DoView Planning Method (Simple)
See. Plan. Do.
This page is now something of a legacy page. It sets out the original DoView Planning process. The latest iteration of DoView Planning is now based on DoView Boards: AI-generated, interactive, fully editable HTML DoView models. The best way to develop a comprehensive understanding of the current approach to DoView Planning is to work through the 20 questions that anyone running or overseeing any type of organization or initiative needs to be able to answer. All of these questions can be immediately answered simply by using an organization or initiative’s DoView Board.

This page is now something of a legacy page, although it still sets out the original DoView Planning process. The latest iteration of DoView Planning is based around the use of DoView Boards, which are AI-generated, interactive, fully editable DoView models. The best way to develop a comprehensive understanding of the DoView Planning methodology is to go through the 20 key questions that anyone running or having oversight of any type of organization or initiative needs to have the answers to immediately at hand in the one model.
Quick overview
This page provides a simple explanation of the DoView Planning methodology as used with DoView strategy/outcomes diagrams. The examples here show the use of DoViews in PowerPoint/Google Slides.
For detailed discussion, see the Detailed Method page. DoView Planning can be applied to any initiative—any organization, policy, or strategy, collaboration, joint venture—across any sector or topic.
DoView Planning is suited to today’s emerging hybrid human–AI world. It can support planning and execution for collaborations between humans and AI, help AI systems communicate with humans, and may even help in the management of AI systems themselves.
We encourage anyone to use DoView Planning freely, in profit or nonprofit settings (with acknowledgment). Currently, most planning can be done in PowerPoint, Google Slides, or the award-winning DoView legacy app. The legacy app’s unique features greatly assist with large-scale DoView Visual Alignment; however, even just doing the first step in DoView Planning using PowerPoint, visualizing outcomes, is very valuable for any organization or initiative. It ensures everyone involved is literally working off the same page.
In future, we hope planning platforms like Microsoft Project will incorporate DoView’s high-level visualization, complementing the detailed lower-level project management they already support.
DoView Planning can be used independently in apps such as PowerPoint, Google Slides, or the DoView legacy app, or in collaboration with us. For more details, see the Detailed Method page; the DoView Book, which includes the 100+ DoView Planning Tools; or the Theory page on outcomes theory, which DoView Planning is based on and makes sure that DoView Planning is conceptually robust.
DoView Planning is divided into five steps, outlined below.

A. Show your outcomes in a DoView Board
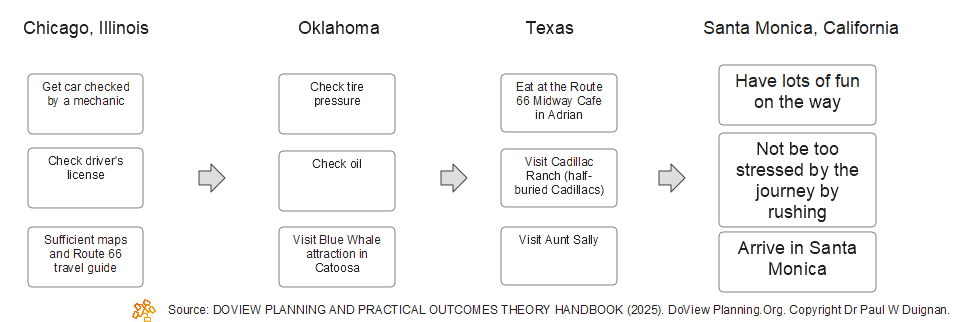
DoView Boards (strategy/outcomes diagrams) are used to set out and communicate any type of strategy in a visual format, which is much more accessible than traditional text-based strategic plans. DoViews should be seen as ‘This-Then’ diagrams, outlining all of the steps that may be used to achieve desired high-level outcomes. One can think of DoViews as being similar to setting out all the ‘This-Then’ steps required for a successful road trip, as illustrated below.
An illustrative example of a DoView
DoView Boards are drawn according to a set of DoView Drawing Rules that lay out the rules for drawing well-formed DoViews (see the DoViews page for examples of real-world DoViews). Many different types of visual outcomes models can be built, but using the DoView rules means that your diagram will be fit for purpose for all stages of the DoView Planning process. Here is an illustrative DoView made in PowerPoint for a fictitious ‘Archery Initiative’, which is the example used throughout this website and in the DoView Book. Just as all of the boxes needed to go on a road trip were set out in the road-trip DoView above, the Archery Initiative DoView sets out all of the boxes which are on the pathway to achieving the Archery Initiative’s high-level outcomes. You can build a DoView yourself using the DoView Drawing Rules or use the free ChatGPT AI DoView Drawing Prompt to create one in PowerPoint. The Archery Initiative is used on this page to illustrate how DoView Planning is undertaken. (For more detail on each of the steps in the process see our Detailed Method Page).

DoViews are typically structured into an overview plus drill-down pages
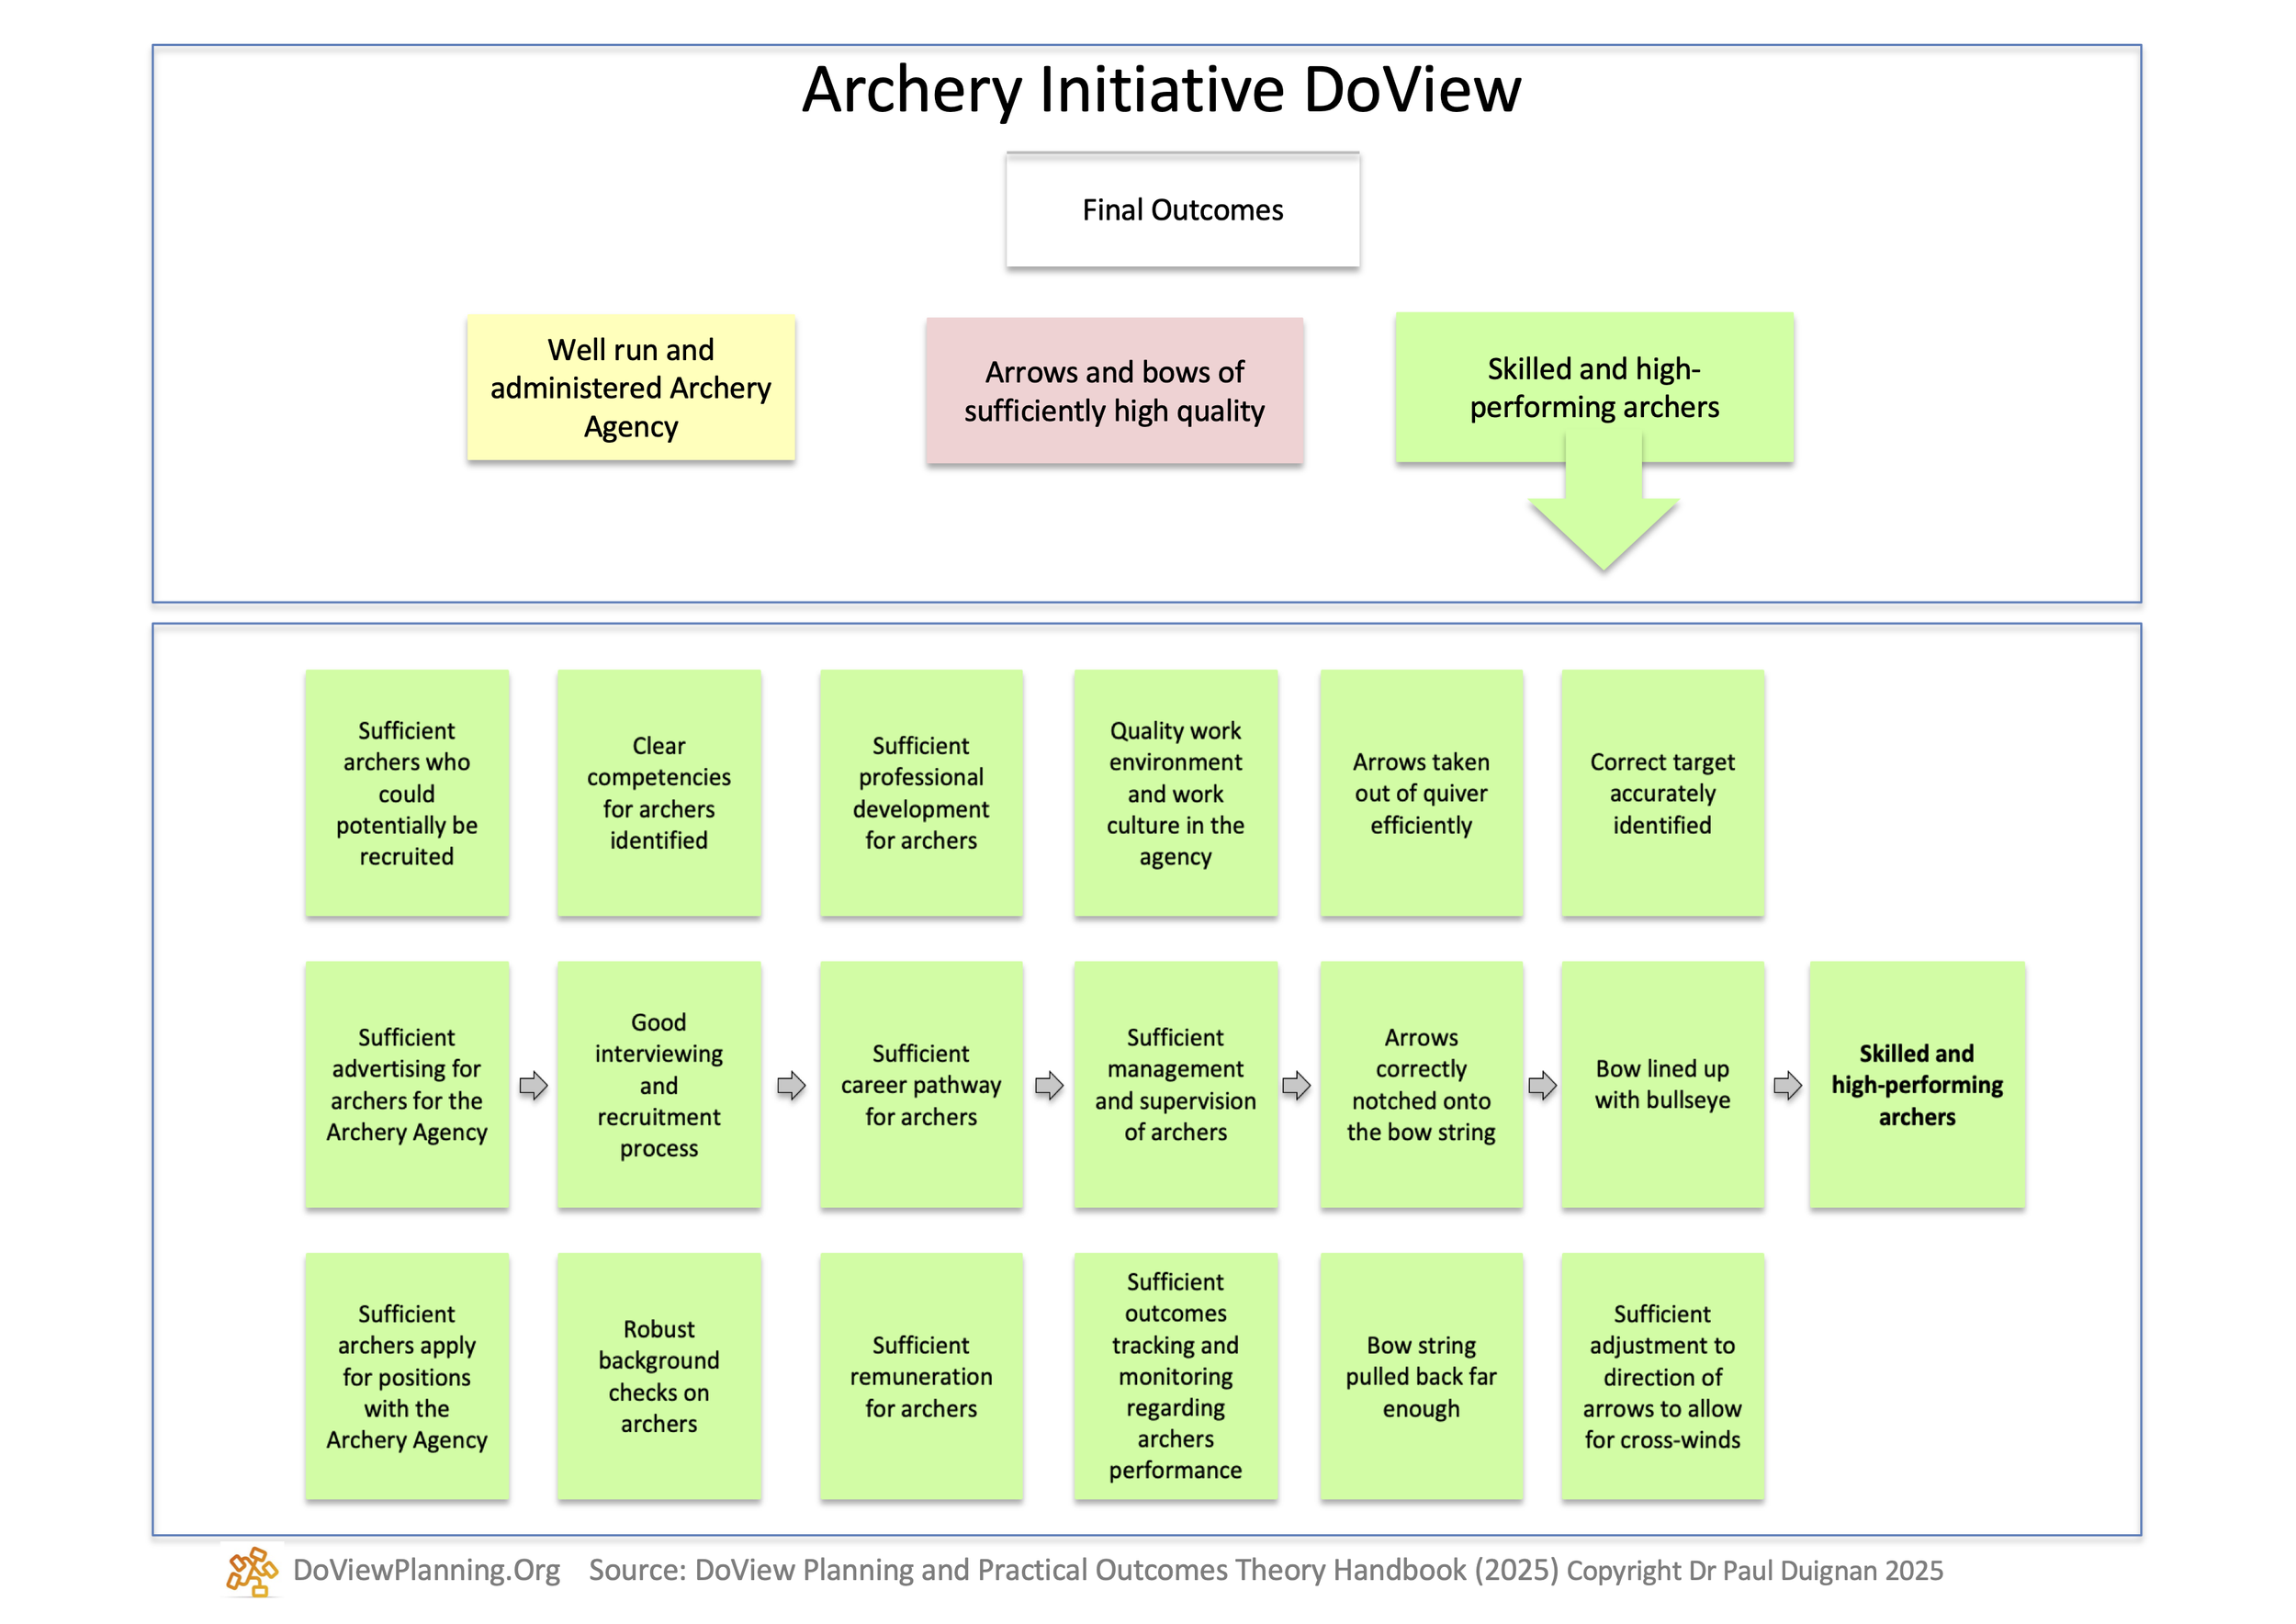
When used with real-world initiatives, DoViews normally need more than just a single page. They are therefore structured into an overview page that shows boxes for each of a set of drill-down subpages. When using a DoView in PowerPoint (if you create it with the free ChatGPT AI DoView Drawing Prompt) or when using it in the DoView legacy app, you can click on the name of any subpage and immediately drill down to the subpage to see more detail. This means that the reader can get a helicopter overview, then click to drill down to get a detailed look at a subpage and then jump back again to the overview. Because you can navigate DoViews in this way, it is much easier to quickly grasp their content than if the same information were presented in a text-based strategic plan. Below, you can see how the Archery Initiative DoView could have been constructed as an overview page, together with a set of drill-down pages rather than just a one page DoView. The green subpage below, called ‘Skilled and high-performing archers’, is accessed in the PowerPoint by clicking on the green ‘Skilled and high-performing archers’ box on the overview page.
B. Focus activities on priorities
Set priorities
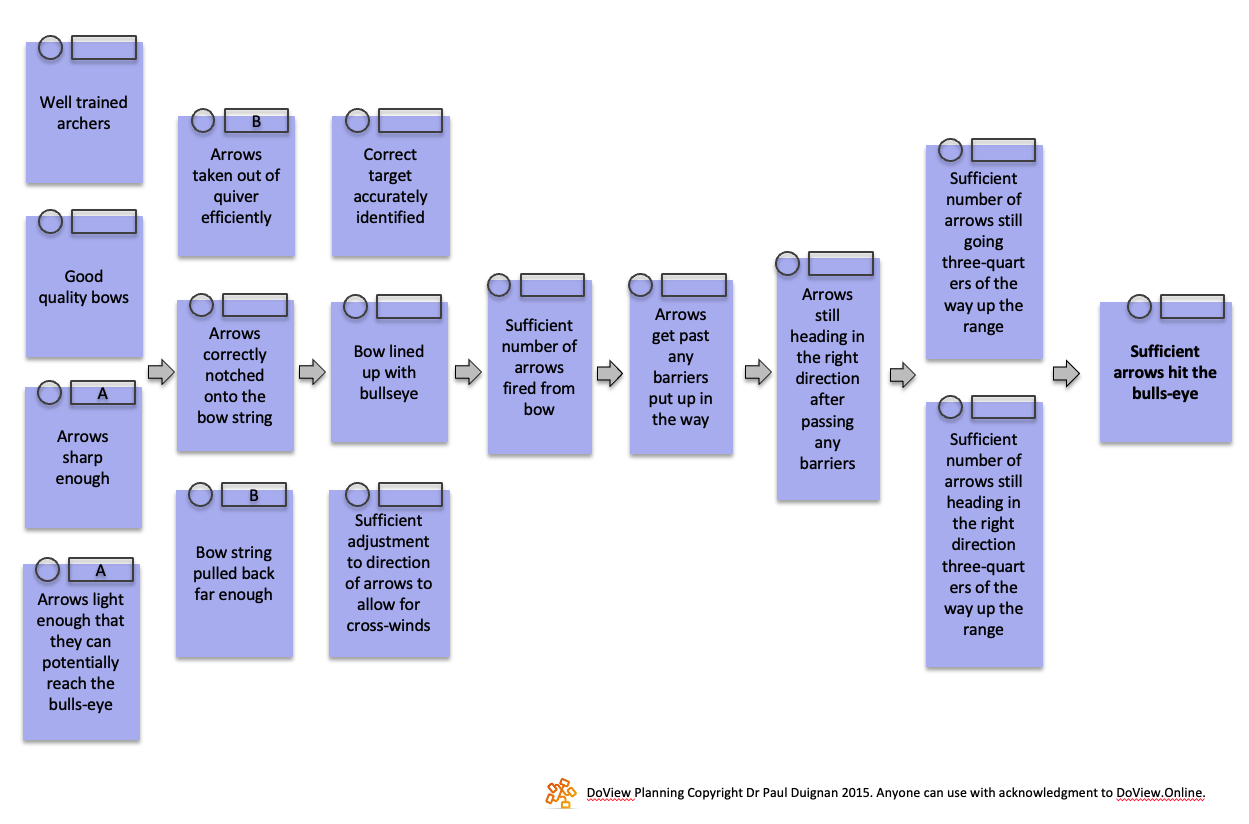
DoViews are deliberately designed to broadly model a range of potential strategic ‘This-Then’ possibilities that may be employed when implementing an initiative. DoViews should be seen as outlining the broad ‘strategy space’ which includes credible strategies that may potentially be used in an initiative to achieve its high-level outcomes. Within any planning period, decisions are made regarding the priority for focusing on particular boxes within the DoView. DoView boxes are typically prioritized A, B, C, D, E or BAU (Business As Usual). For more information on why this DoView Planning approach allows more responsive planning than the traditional text-based strategic planning approach to prioritization see our Detailed Method Page. In addition, the Detailed Methodology Page provides more discussion of the four factors to consider when determining the priority of a box within a DoView.
Below you can see the Archery Initiative, where some of the boxes in the first two columns are marked up as current priorities with A’s or B’s in the small rectangles at the top of the boxes. Note that when using a DoView, if you need to change your strategy, you can do this immediately by just changing the priority of the boxes within the DoView. This is much faster than having to rewrite a traditional text-based strategic plan when your strategic environment changes. This is a great time-saver in situations such as those that we now face, where you may have to instantly change your strategic priorities in response to a rapidly emerging threat or opportunity.
Map activities onto priorities
Alignment—making sure that the projects/activities being undertaken within an initiative are tightly aligned to priority outcomes is essential for the success of any organization or initiative. You can have a perfect set of high-level priorities and, at the same time, be executing all of your projects/activities perfectly. However, if you do not have super-tight alignment between your projects/activities and your high-level strategic priorities, your initiative will be wasting resources and may be failing.
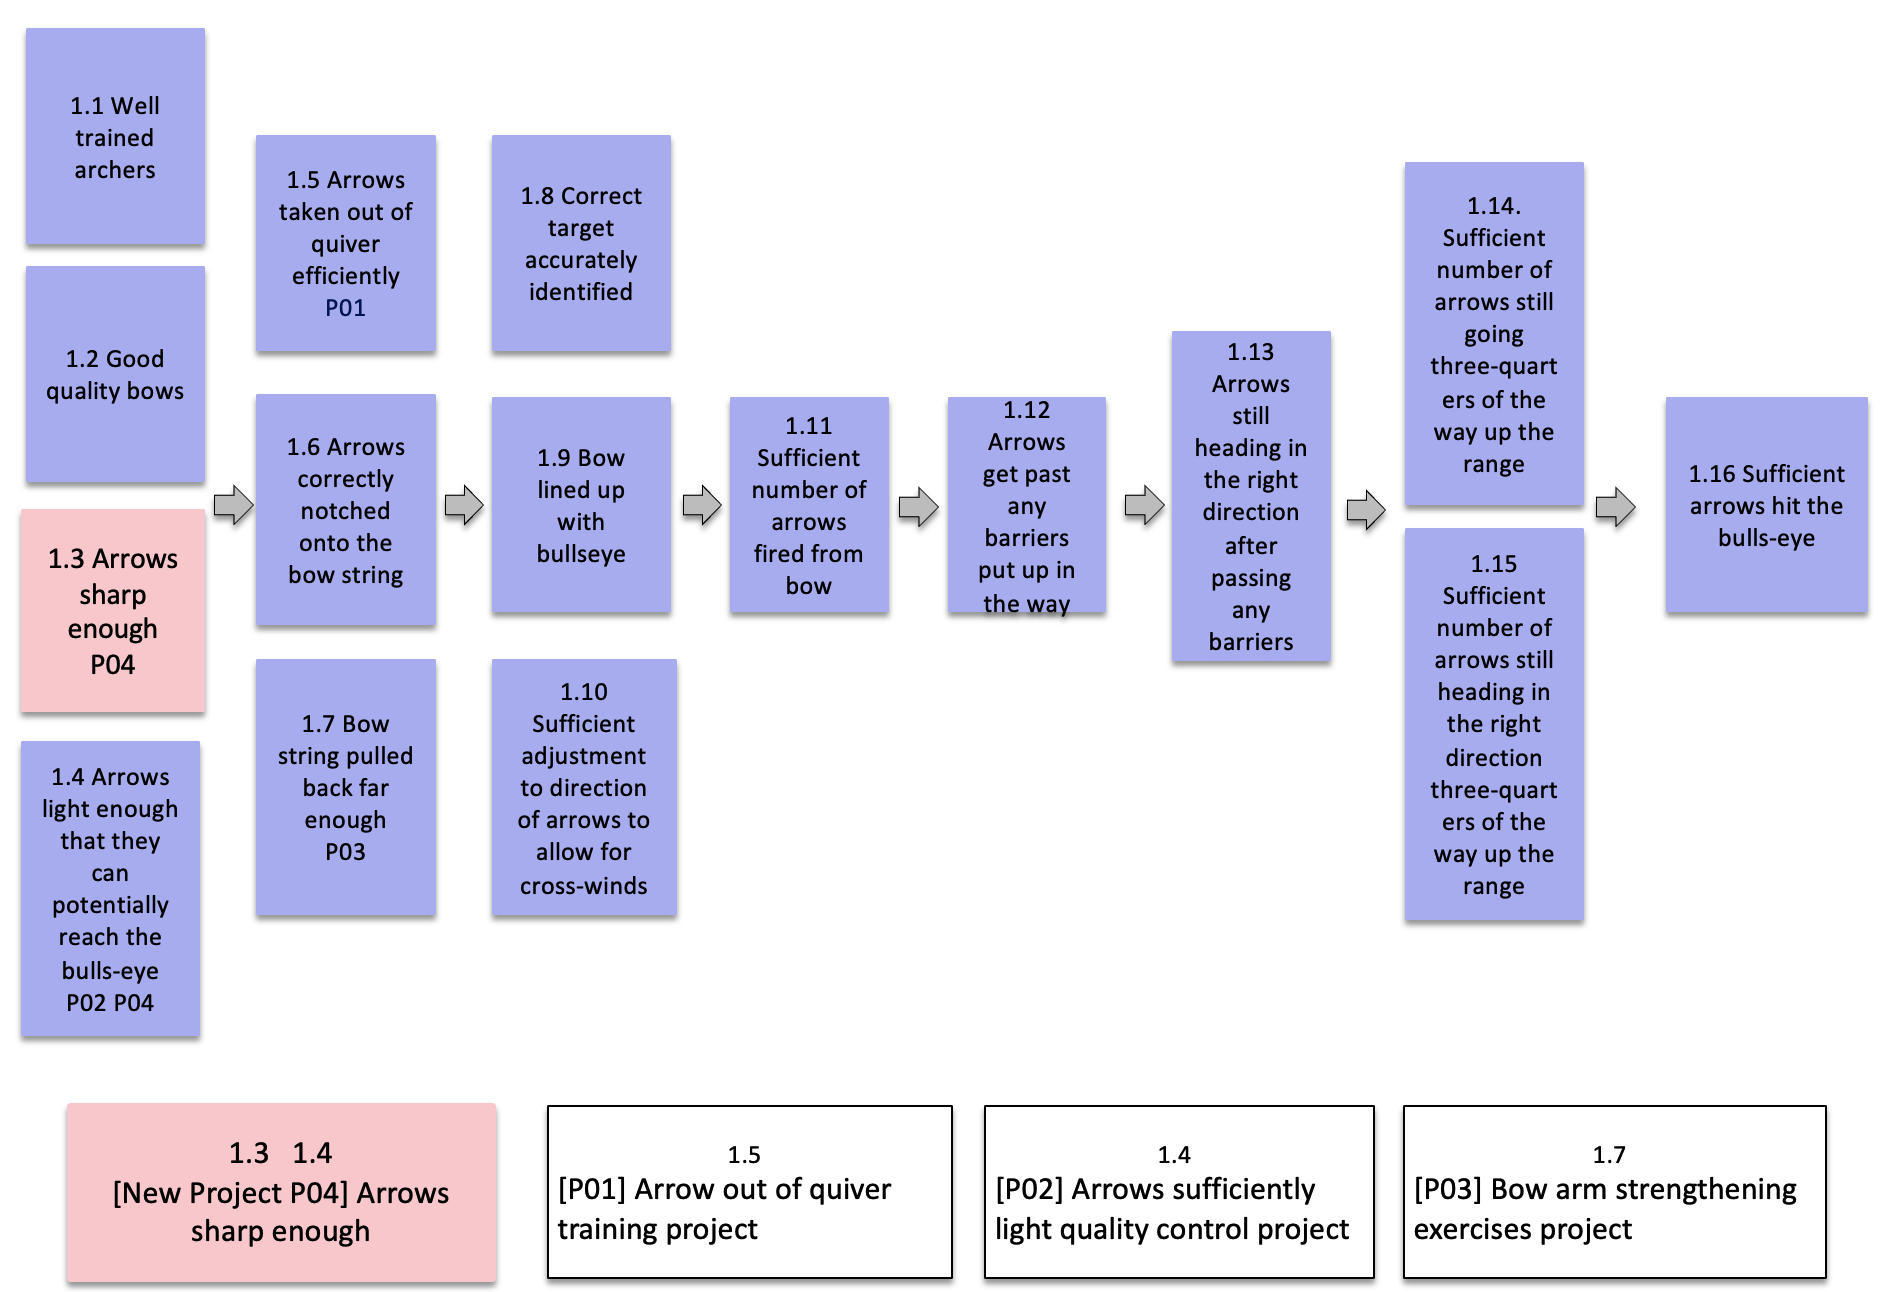
PowerPoint’s features are currently reasonably limited when it comes to doing DoView Visual Alignment. Below uses a simple annotation approach in PowerPoint that shows which projects focus on which DoView boxes. The ID numbers of the projects that focus on a particular box are shown at the bottom of each box (e.g. P01, P02, P03, P04). In addition, the ID numbers of higher-level boxes focused on by a project are shown at the top of each project box e.g. 1.3, 1.4, 1.5, 1.7). You can see from this very simple example below that, prior to introducing the New Project P04 there were no projects focusing on box 1.3 Arrows sharp enough. This means that the DoView was not fully aligned. Look at our Detailed Method page to learn how to do DoView Visual Alignment at scale when using the DoView legacy app. The hope is that in the future, a number of apps, platforms and systems will include the unique features of the legacy app, which allow you to do large-scale DoView Visual Alignment with large numbers of higher-level boxes and projects/activities.
Work is currently going on to attempt to create a free ChatGPT AI DoView Alignment Prompt, which will automatically map projects onto boxes within a DoView in PowerPoint. In the meantime, for initiatives with a small number of projects, you can do this manually as illustrated below.
C. Measures, indicators and accountabilities
Identify Key Performance Indicators (KPIs)
Measuring an initiative’s performance and monitoring delegation and contracts involves identifying Key Performance Indicators (KPIs), additional higher-level indicators, and identifying evaluation questions that need to be answered. Information from these is then used to improve the impact of an initiative. In DoView Planning, you do all of this by mapping indicators and evaluation questions onto the relevant boxes within your DoView. Using DoView’s visual approach reduces the mental effort (cognitive load) required when doing indicator, performance management and impact evaluation work.
In regard to indicators, mapping them onto a DoView means that you can instantly see how many of the boxes in your DoView have indicators that measure them. It is important to be able to visualize the boxes for outcomes and the steps believed to lead to them separately from the indicators that measure such boxes. Being able to represent your steps and outcomes (the boxes) separate from their measures (the indicators placed next to the relevant boxes) is the best way to ensure that your strategic discussions factor in things that are currently difficult or even impossible to measure. Non-visualized approaches to performance management and strategy, that just represent KPIs and indicators without the underlying boxes they are measuring, do not let you take into account currently hard or impossible to measure boxes.
Putting indicators directly onto a DoView can be done easily when working with a DoView in PowerPoint or Google Slides. Below is an example of how indicators have been added to the Archery Initiative DoView. Note that the DoView convention has been used of marking controllable indicators (KPIs) (used for accountability) with an @ to distinguish them from non-necessarily controllable higher-level indicators that an initiative may not fully control and therefore improvements in which can not be automatically attributed just to the initiative. See the Detailed Method page for discussion of the various ways in which such indicator mapping can be used to amplify impact when doing DoView Planning.

D. Evaluate success and impact
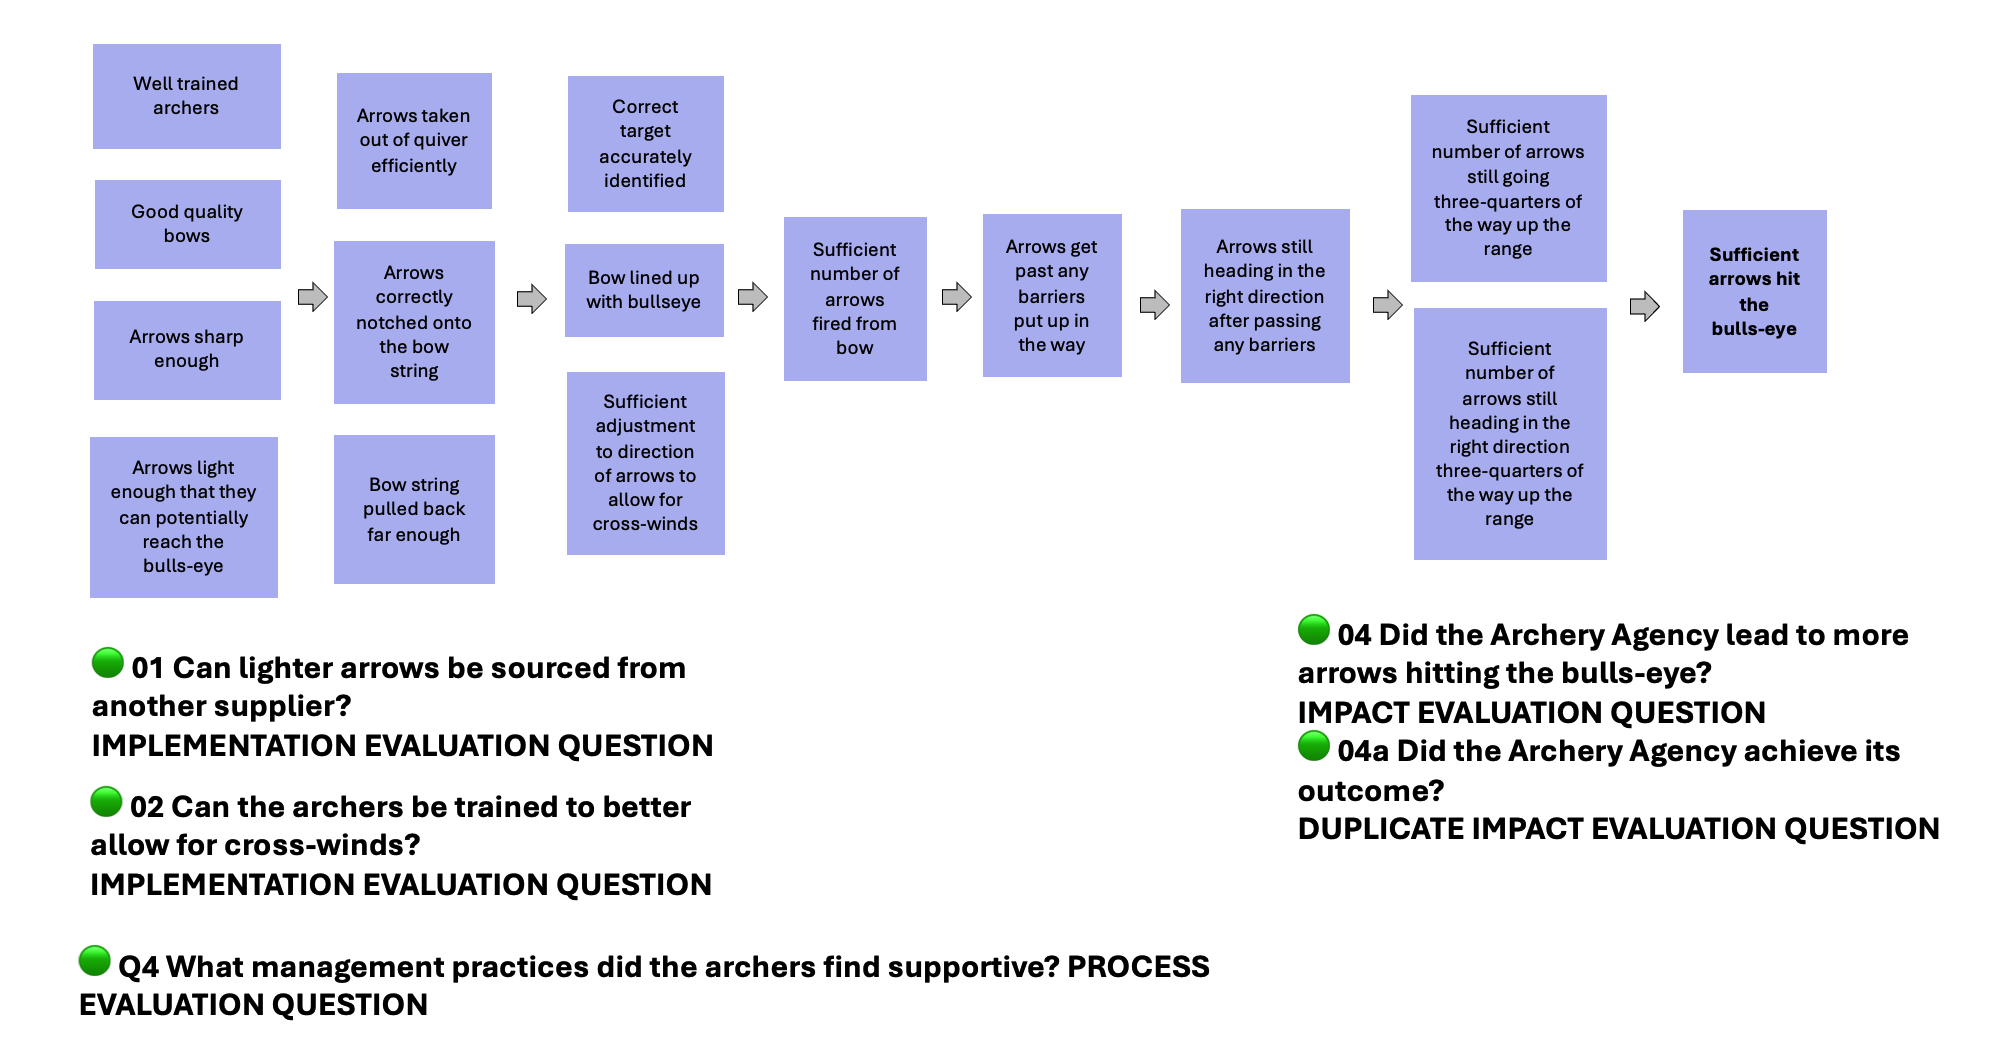
Just as indicators have been mapped onto the DoView diagram above, evaluation questions can also be mapped onto a DoView. This means that you can immediately see the ‘level’ at which an evaluation question has been struck. Without the aid of a DoView diagram, it can be hard to quickly work out the exact level at which an evaluation question has been struck. Using visual mapping of evaluation questions onto the relevant DoView is also the fastest way of identifying if different wordings of an evaluation question are actually just different versions of the same evaluation question. This is the case in regard to evaluation questions 04 and 04a below. See the Detailed Method Page for more discussion of how DoViews can help in evaluation planning.
E. Dashboard your results to improve performance
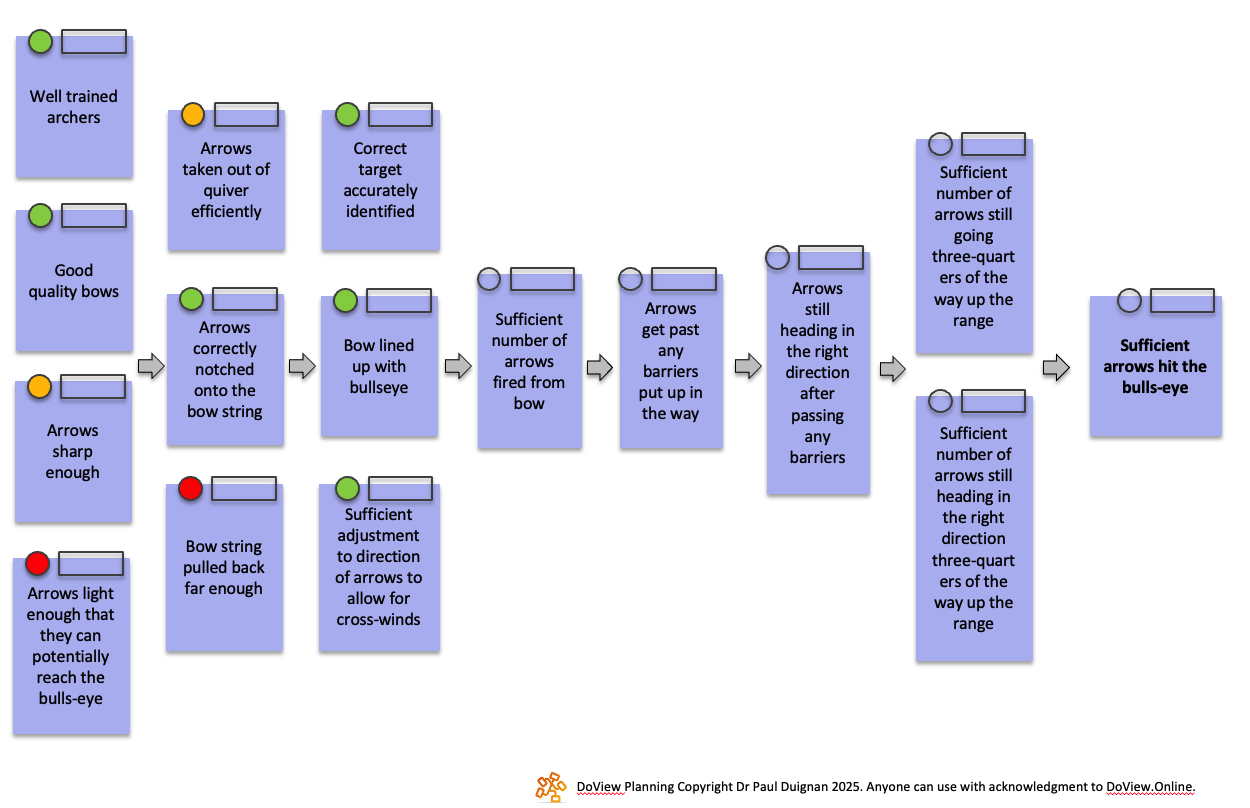
You can traffic light the status of the boxes in a DoView to show how much progress has been made on each box at a particular point in time. Those involved in strategic decision-making need to reach an agreement on how much progress has been made in an initiative before making decisions about their forward strategy. Doing this by traffic-lighting the boxes within a DoView diagram is a robust way of ensuring that decision makers actually agree on the progress being made in different areas of the initiative. For more information on ways of determining the current status of boxes in a DoView, see our Detailed Method Page. Below shows the traffic-lighted Archery Initiative DoView. A ChatGPT AI DoView Traffic Light and Priority Icon Prompt is currently being worked on that will insert the small circle and rectangle shown on each box shown below into a PowerPoint version of a DoView which has been created by the free AI DoView Drawing Prompt.
In addition to traffic lighting, you can put more information from indicator measurement and results from answering evaluation questions directly onto a DoView so that the results are shown in relationship to the boxes that they are measuring or evaluating. For more on this see the Detailed Method Page.