
Anthropic’s DoView Strategy Diagram [/a034]

ENDS
A DoView About Something
This would be some text which would be not the full width of the screen but the DoView as a background would as below would be full width.
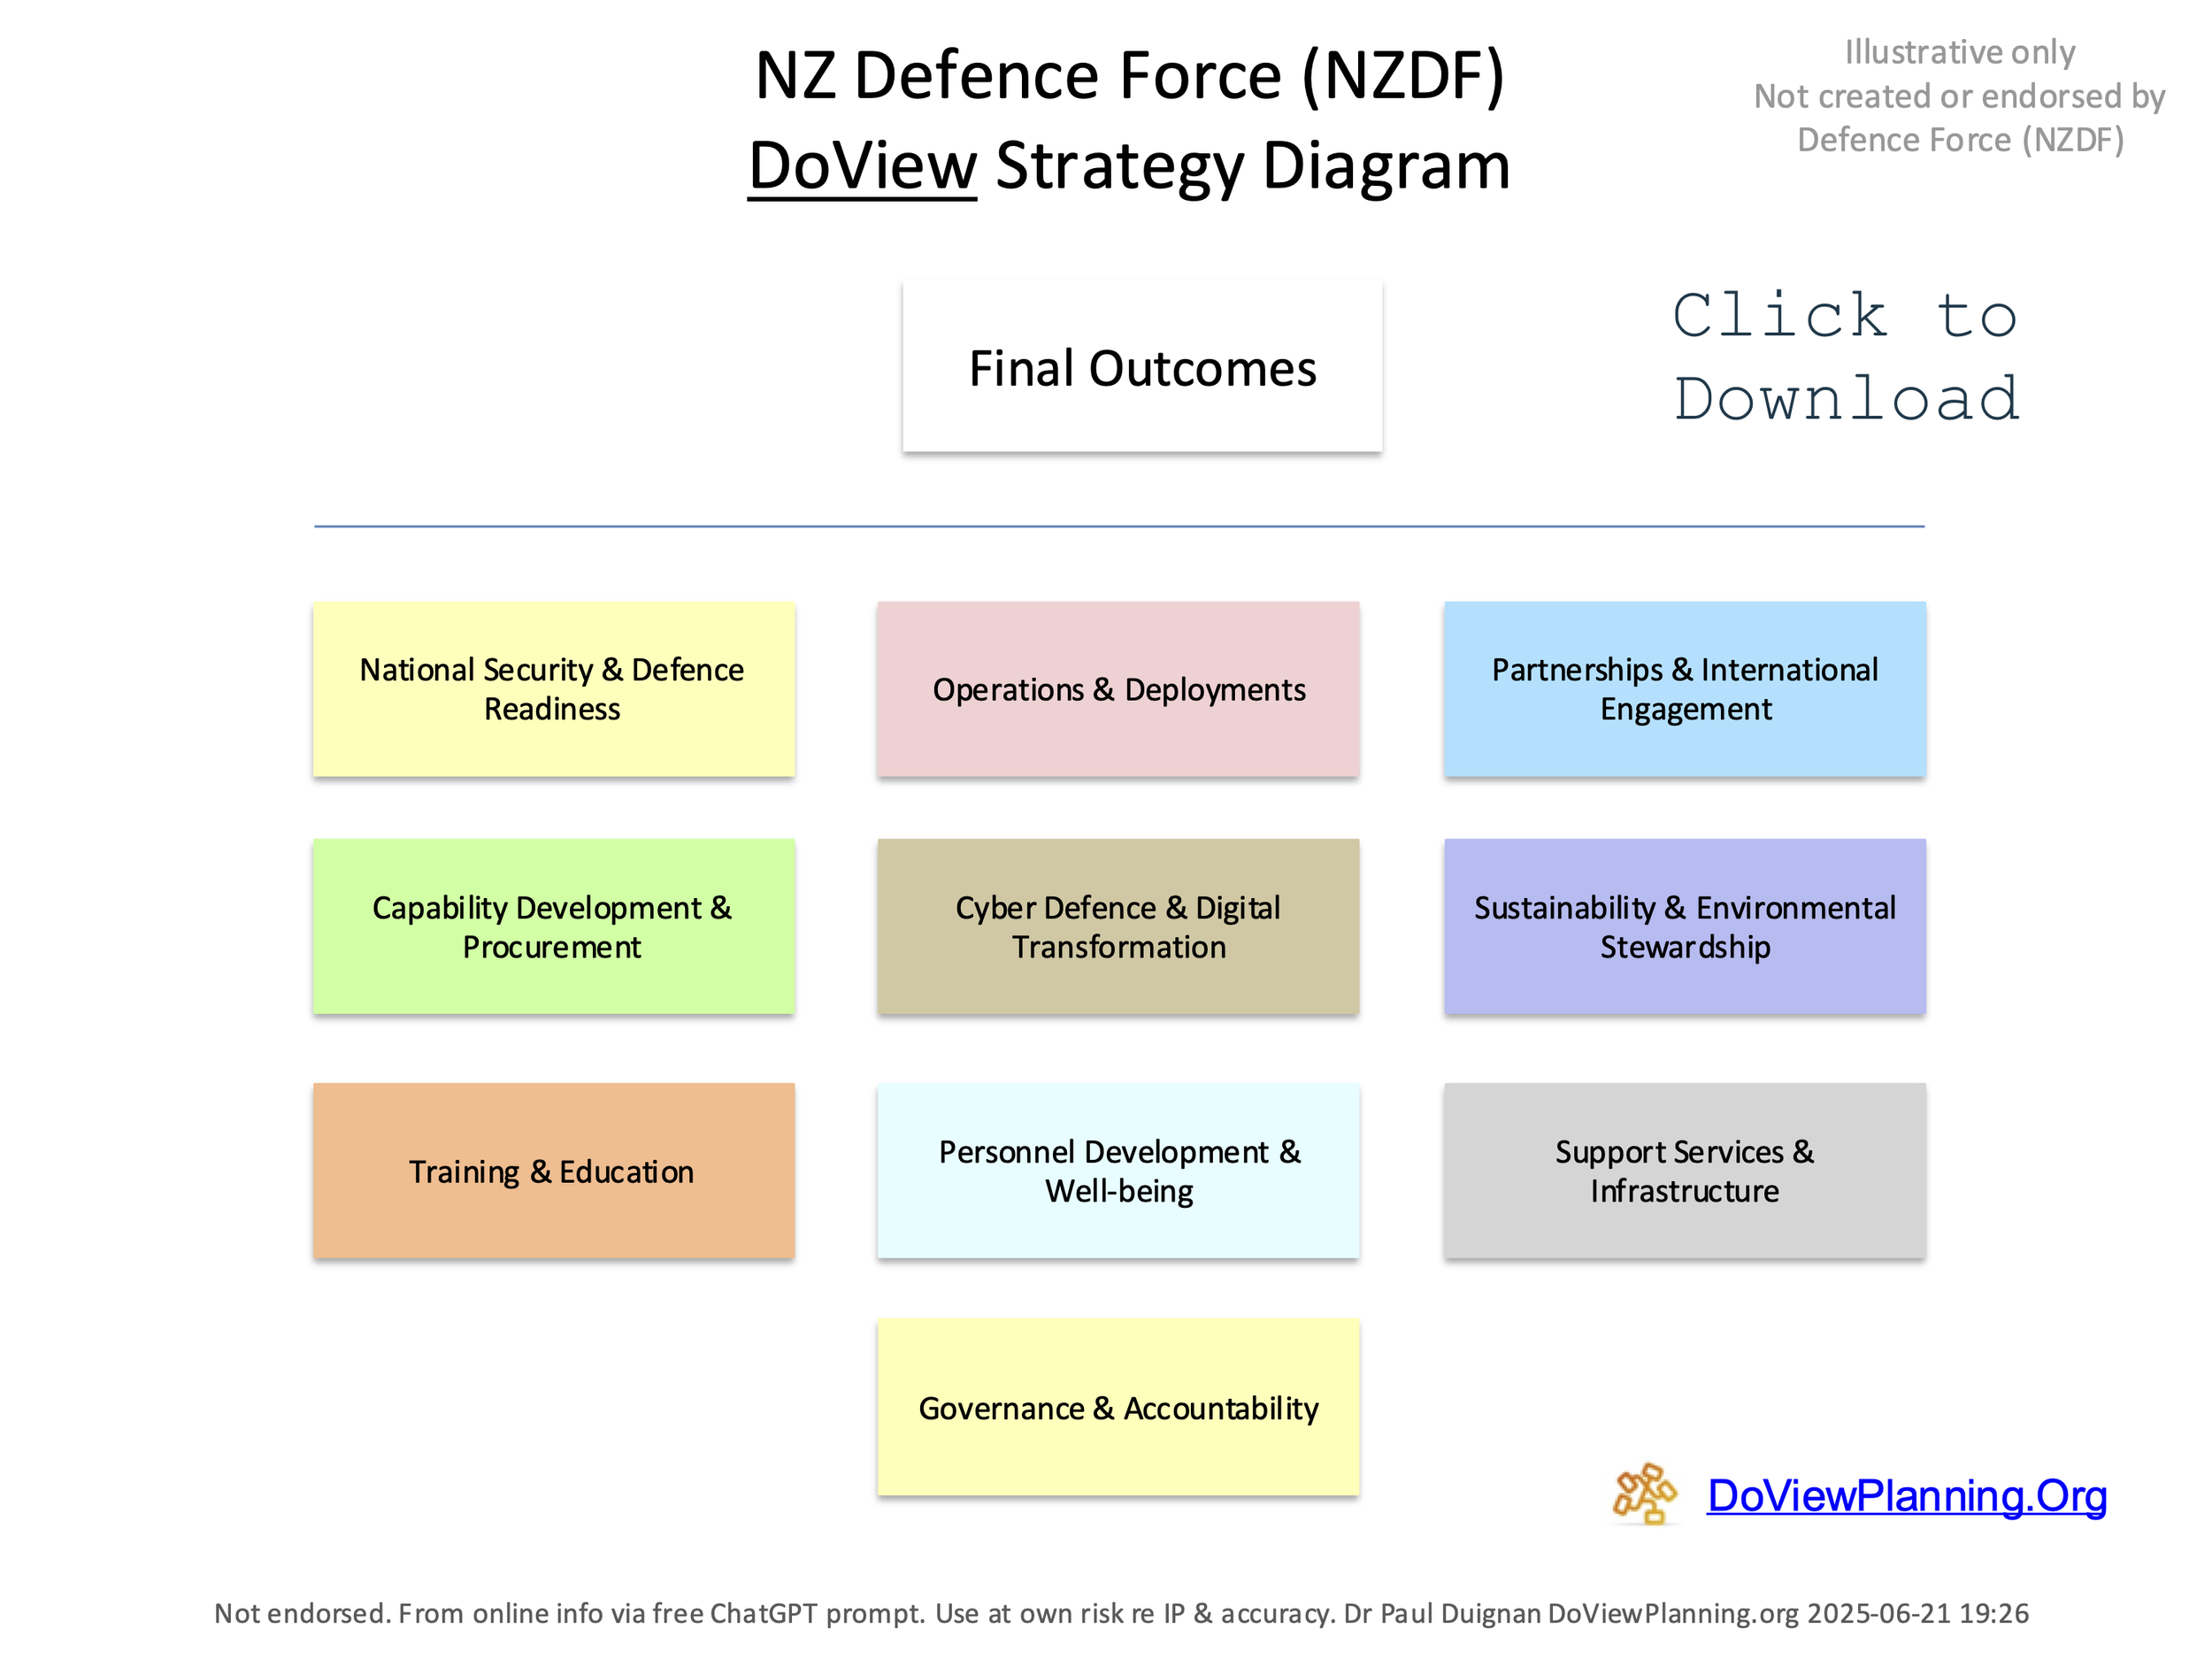
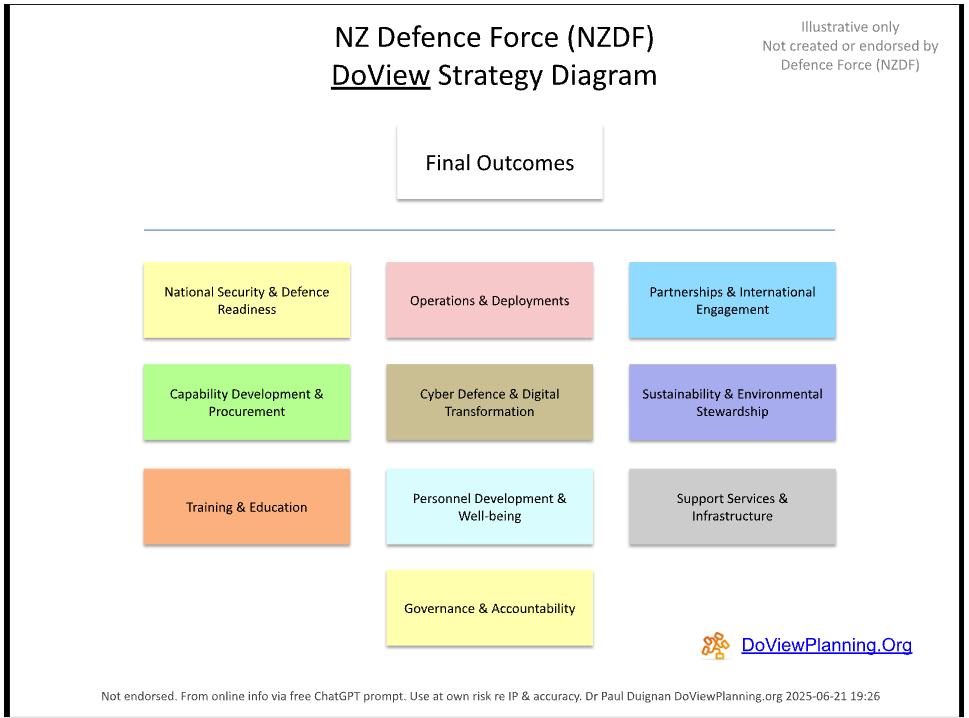
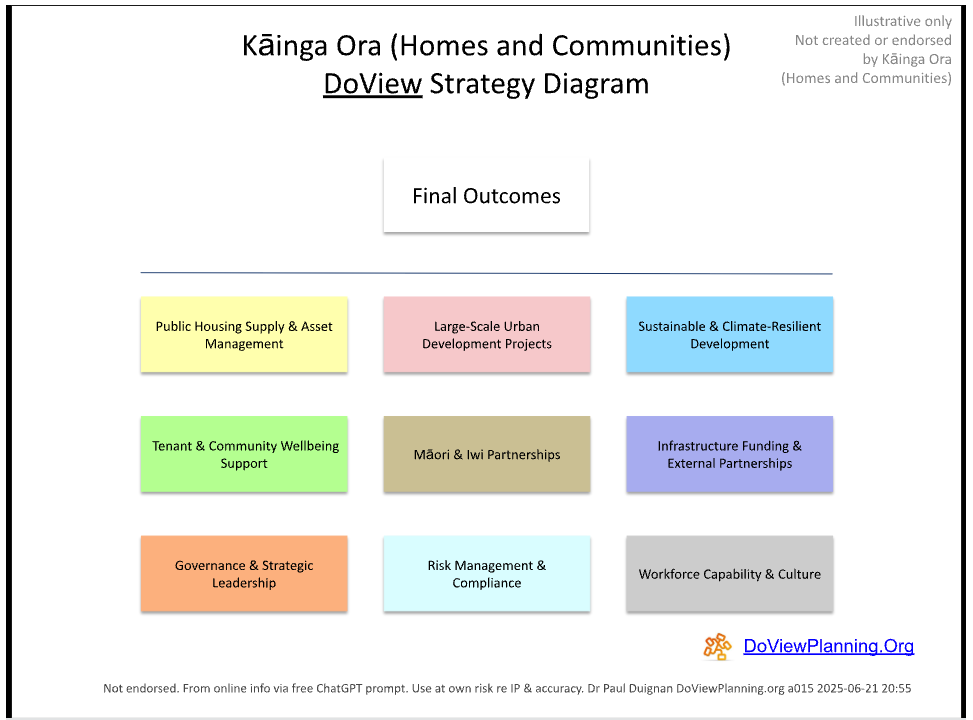
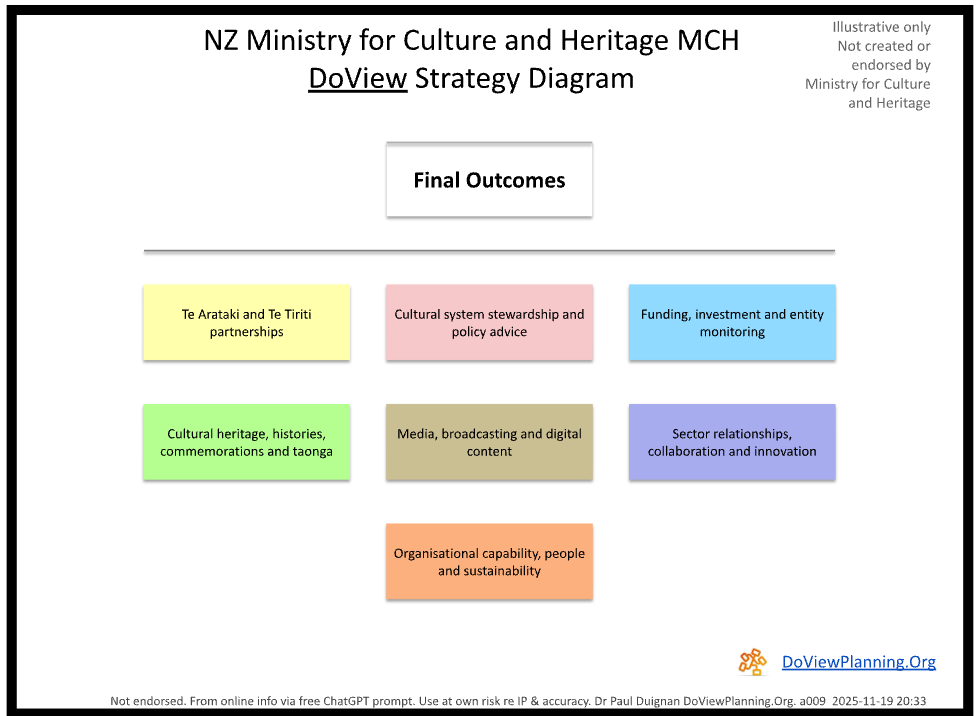
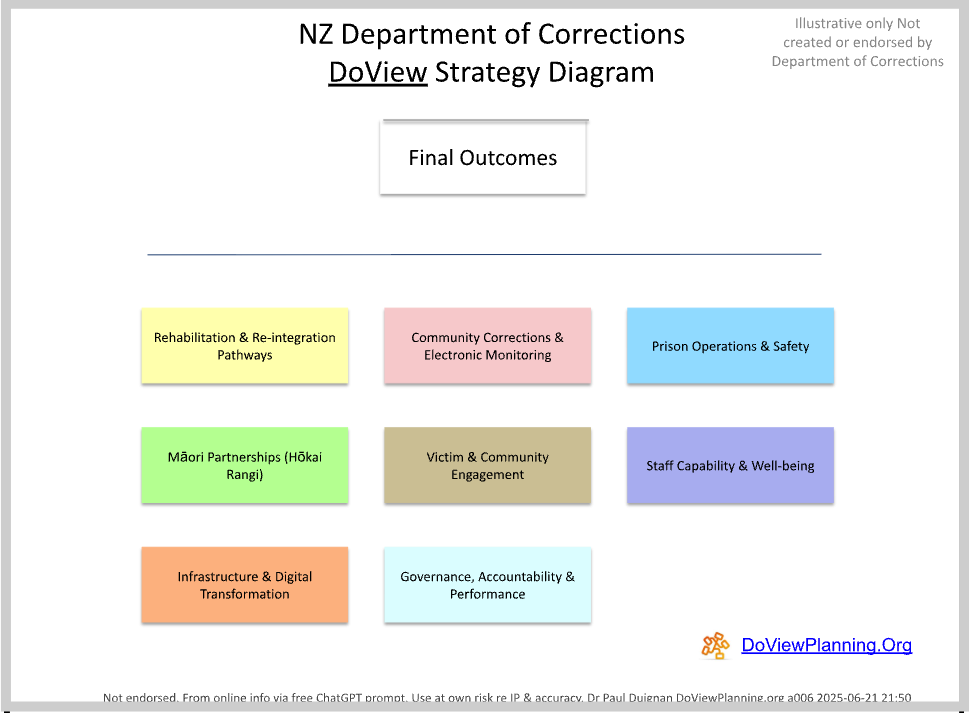
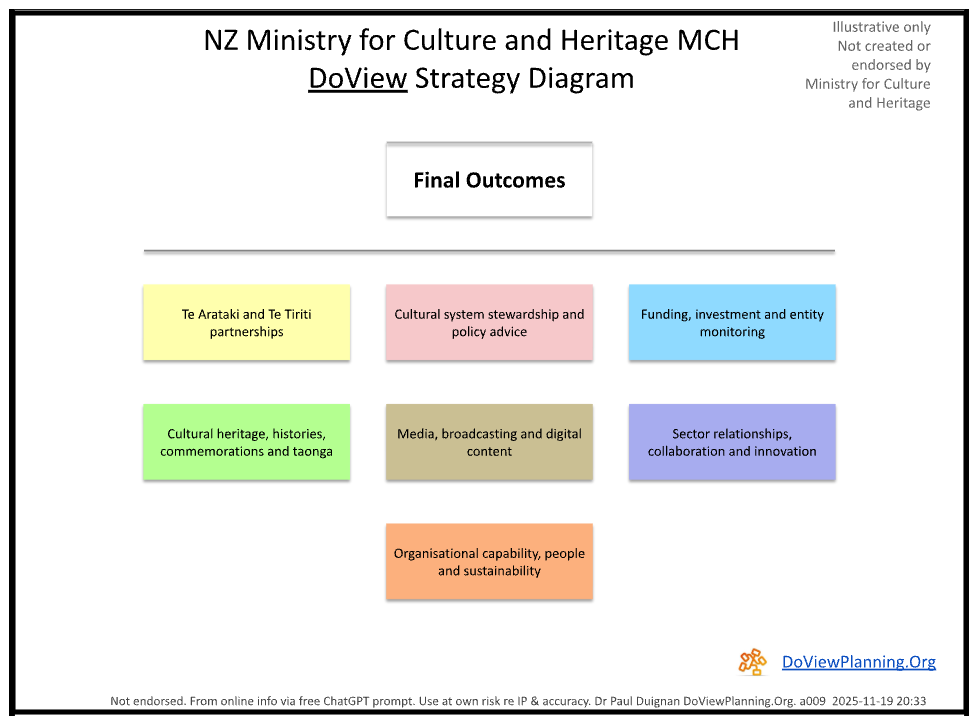
DoView below shows how a Whole of Government DoView can be built. In this case, it is an illustrative Whole of Government DoView for the New Zealand government. If you click in it, you can immediately drill down first to a set of high-level cross-sector government targets. In this illustrative DoView these are based on the current New Zealand governments set of nine targets. DoView Strategy Diagrams have been built for each of the nine target areas. These set out the possible steps that could be taken to achieve these targets. While the targets are current government targets, these DoView are illustrative and not created or endorsed by the NZ government. In the Whole of Government DoView you can also drill down to DoViews for individual government departments. In this illustrative version of the NZ Whole of Government DoView, only some government agencies’ DoViews have been included. These and more individual government agency DoViews are given further down this page. Any of the DoViews on this page could easily be included in the NZ Whole of Government DoView.

| Company | Full Screen | PowerPoint | |
|---|---|---|---|
| Anthropic’s DoView | Full Screen | PowerPoint | |
| Apple’s DoView | Full Screen | PowerPoint | |
| Google’s DoView | Full Screen | PowerPoint |
Hello, World!
| DoView | Full Screen | PowerPoint | |
|---|---|---|---|
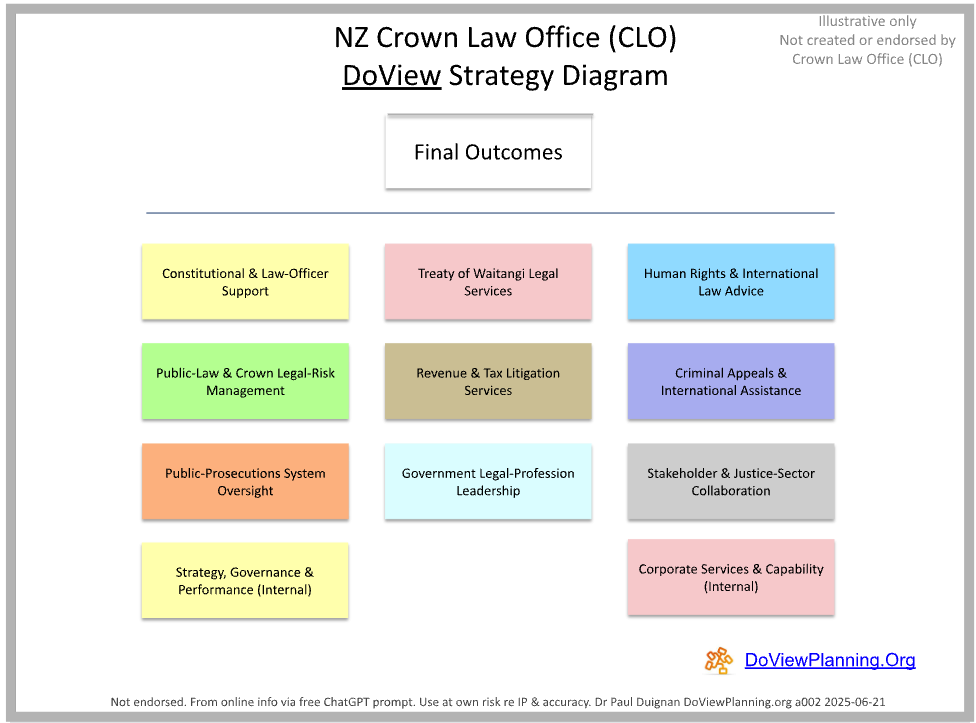
| NZ Crown Law Office (CLO) DoView | Full Screen | PowerPoint | |
| NZ Customs Service DoView | Full Screen | PowerPoint | |
| NZ Defence Force (NZDF) DoView | Full Screen | PowerPoint |
Hello, World!
Click  to select Full Screen.

Click and select Full Screen for desktop.
Click
to select Full Screen.
Click on three dots to select Full Screen on desktop.
this is text
Hello, World!
This is the ext one which is here which you need to answer normall I know it is

Awards
Dream it
2022
Build it
2021
Grow it
Sell it
2019
2020
WHAT is the general way in which doviews are constructed?
As discussed earlier, various types of outcomes diagrams and visual models are increasingly being used at multiple levels within government.
People often ‘just draw’ ad hoc models and diagrams to make a point by presenting information visually. They draw such models in any way that they think will help busy decision-makers understand what a proposed strategy, policy or initiative will do and the outcomes it is attempting to influence. In addition to ad hoc diagrams, people involved in planning are also increasingly drawing specific types of models that go by different names such as: intervention logics, theories of change, program theories, program logics, results chains, results roadmaps, outcomes models and strategy diagrams.
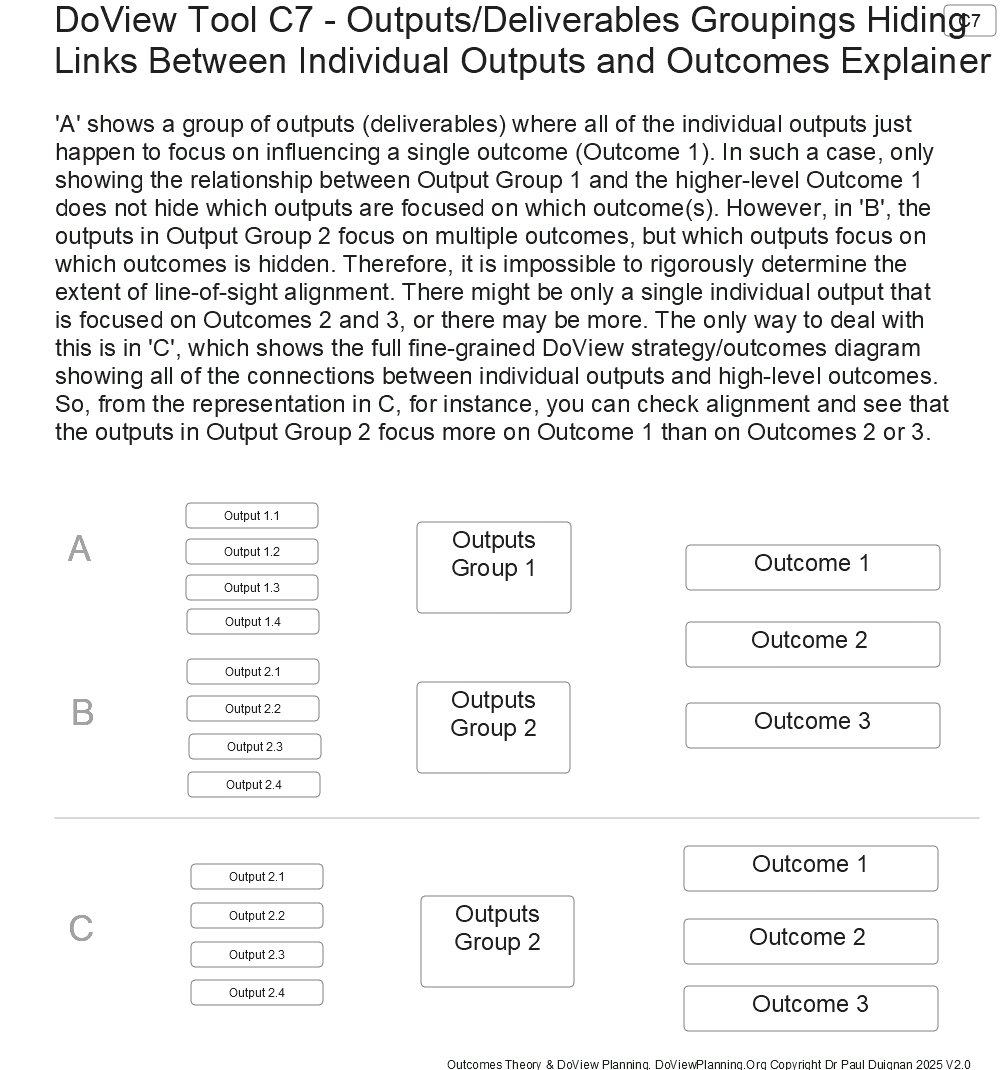
DoViews—standardized interactive drill-down strategy/outcomes diagrams used in DoView Planning—are a particular type of visual strategy model. Their layout is illustrated in the tool on the next page. They are drawn according to a formal set of rules to ensure that they are fit-for-purpose for all stages of the government planning, action and reporting process. These standardized strategy/outcomes diagrams set out all of the higher-level outcomes for an initiative or policy, and all of the lower-level steps it is believed are required to achieve them.
One way of thinking about these diagrams is to imagine them rather like a visual diagram of a road trip as is illustrated in the tool ‘A DoView Shown as a Roadtrip Example (B3). It shows a ‘Route 66 DoView’. Route 66 is a classic United States’ roadtrip. This tool provides a very simple example of the concept of DoView as used in DoView Planning. Note that in practice, real-world strategy diagrams usually contain a number of drill-down levels below the top level.
DoView diagrams can be drawn from bottom-to-top or from left-to-right. The left-to-right approach has advantages for readers whose language is written from left to right. In such a case, the reader’s eye is naturally drawn across the diagram from initial steps on the left to the outcomes that are located on the right-hand side
